Study 3 examined whether the same results as in Study 1 and 2 were observed when children performed the stick figure task first, followed by the photo stimuli task. Specifically, we collected additional data with another group of children using the tasks presented in the reverse order of the previous studies. Moreover, Bian et al.14 reported that the observed gender stereotype effects were more apparent in a larger sample size. Thus, we analyzed the merged data of Studies 1, 2, and 3 while controlling order effects.
Participants
We randomly recruited 100 participants (50 girls and 50 boys) and their parents, in each age group, from a database (Cross Marketing Inc. Tokyo, Japan). A total of 38 children (seven 4-year-old, two 5-year-old, five 6-year-old, and one 7-year-old girls, and six 4-year-old, nine 5-year-old, four 6-year-old, and four 7-year-old boys) did not pass the screening questions for either one of the two traits (smart or nice); these children were excluded from the analyses. Moreover, a total of 17 children (three 4-year-old, two 5-year-old, one 6-year-old girls, and three 4-year-old, four 5-year-old, one 6-year-old, and three 7-year-old boys) did not pass the screening questions for the stick figure. The characteristics of the final sample are listed in Table 2. There were no significant differences in the months between the girls and boys in the merged data (p = 0.272). None of the children had any known developmental abnormalities. Informed consent was obtained as in Studies 1 and 2.
Procedure
The procedure was the same as that in Studies 1 and 2, except for one point. That is, children participated in the stick figure task first, followed by the photo task.
Analytic plan
The analyses were the same as in Studies 1 and 2. The analyses were conducted separately for the photo stimuli task and the stick figure task.
Results and discussion
Photo stimuli task
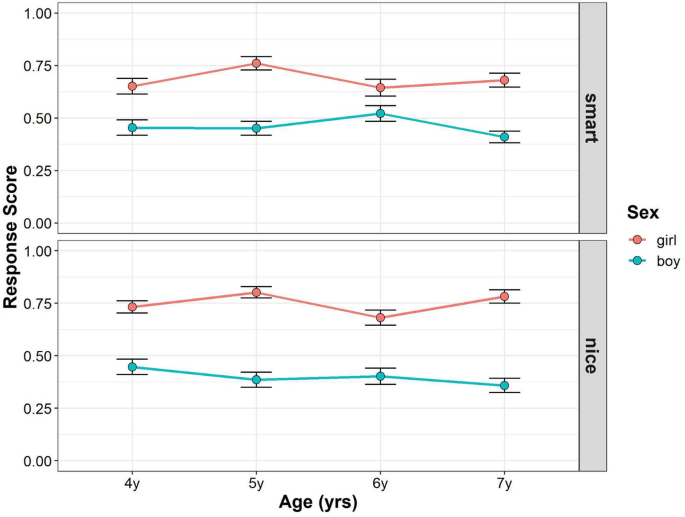
Figure 3 shows the developmental changes in children’s response scores in the photo stimuli task in Study 3 (see also Supplementary Tables S4, S5). To assess whether and how age, gender, and trait were related to the mean gender stereotype scores, we conducted multilevel mixed-effects linear modeling. For interaction terms, we found no significant effect of interaction among trait, gender, and age (F (3, 4354) = 0.372, p = 0.773, power = 0.140) and between age and trait (F (3, 354) = 1.722, p = 0.162, power = 0.457), but we found significant interactions between trait and gender (F (1, 354) = 21.378, p < 0.001, power = 0.996), and age and gender (F (3, 353) = 4.01, p = 0.008, power = 0.838). For the main effects, we found significant main effect of gender (F (1, 353) = 208.401, p < 0.001, power = 1), but the main effects of age (F (3, 353) = 1.061, p = 0.366, power = 0.258), and trait (F (1, 354) = 0.072, p = 0.789, power = 0.055), were not significant. The main effect of the parents’ gender (F (1, 353) = 1.148, p = 0.285) was also not significant.

Developmental change of children’s response scores in photo stimuli task in Study 3. Boys’ (blue) and girls’ (red) mean scores (dots) are shown. Error bars represent ± 1 SE.
Follow-up pairwise comparisons were performed to compare the mean gender stereotype scores between the boys and girls for each age and trait. In the smart traits, girls scored higher than boys in each age group (4-year-olds: girl–boy = 0.198, t(625) = 3.997, p < 0.001; 5-year-olds: girl–boy = 0.308, t(625) = 6.278, p < 0.001; 6-year-olds: girl–boy = 0.122, t(625) = 2.518, p = 0.001; 7-year-olds: girl–boy = 0.275, t(623) = 5.785, p < 0.001). In the nice traits, girls scored higher than boys in each age group (4-year-olds: girl–boy = 0.287, t(625) = 5.794, p < 0.001; 5-year-olds: girl–boy = 0.415, t(625) = 8.451, p < 0.001; 6-year-olds: girl–boy = 0.279, t(625) = 5.753, p < 0.001; 7-year-olds: girl–boy = 0.428, t(623) = 8.996, p < 0.001). Although girls’ gender stereotype scores were higher than those of boys in both the smart and nice traits, the difference between boys and girls was stronger in the nice traits than smart traits.
Moreover, we tested whether the children’s gender stereotype scores differed from chance level at each gender and age for each trait. For girls’ gender stereotype scores in the smart traits, the children’s scores were significantly higher than the chance level in all age groups (4-year-olds: t(597) = 4.408, p < 0.001; 5-year-olds: t(599) = 7.751, p < 0.001; 6-year-olds: t(598) = 4.319, p < 0.001; 7-year-olds: t(600) = 5.531, p < 0.001). For boys’ gender stereotype scores in the smart traits, the 7-year-old children’s scores were marginally lower than the chance level, but the 4-, 5-, and 6-year-old children’s scores were not (4-year-olds: t(602) = − 0.930, p = 1; 5-year-olds: t(599) = − 0.947, p = 1; 6-year-olds: t(595) = 0.964, p = 1; 7-year-olds: t(616) = − 2.414, p = 0.096). For girls’ gender stereotype scores in the nice traits, the children’s scores were significantly higher than the chance level in all age groups (4-year-olds: t(597) = 6.595, p < 0.001; 5-year-olds: t(599) = 8.936, p < 0.001; 6-year-olds: t(598) = 5.339, p < 0.001; 7-year-olds: t(600) = 8.476, p < 0.001). For boys’ gender stereotype scores in the nice traits, the children’s scores were significantly or marginally lower than the chance level in 5-, 6-, and 7-year-olds, but not 4-year-olds (4-year-olds: t(602) = − 1.137, p = 1; 5-year-olds: t(599) = − 2.659, p = 0.056; 6-year-olds: t(595) = − 2.340, p = 0.098; 7-year-olds: t(616) = − 3.878, p < 0.001). Thus, the results in Study 3 replicated the results in Study 1 in terms of girls’ scores were higher than those of boys for both the smart and nice traits.
Stick figure task
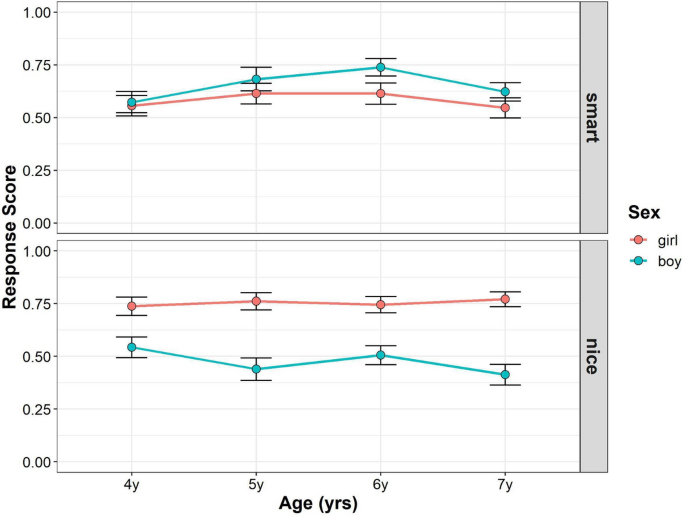
Figure 4 shows the developmental changes in the children’s response scores in the stick figure task in Study 3 (see also Supplementary Tables S4, S6). To assess whether and how age, gender, and trait were related to mean gender stereotype scores, we conducted multilevel mixed-effects linear modeling. For the interaction terms, we found no significant effect of interaction among trait, gender, and age (F (3, 337) = 1.418, p = 0.238, power = 0.385), interaction between age and gender (F (3, 336) = 0.565, p = 0.639, power = 0.194), and trait and age (F (3, 337) = 2.155, p = 0.093, power = 0.575), but we found a significant interaction between trait and gender (F (1, 337) = 77.898, p < 0.001, power = 1). For the main effects, we found significant main effect of gender (F (1, 336) = 16.021, p < 0.001, power = 1), but the main effects of age (F (3, 336) = 1.176, p = 0.319, power = 0.329), and trait (F (1, 337) = 0.021, p = 0.885, power = 0.044), were not significant. The main effects of parents’ gender (F (1, 336) = 0.186, p = 0.667) was also not significant.

Developmental change of children’s response scores in stick figure task in Study 3. Boys’ (blue) and girls’ (red) mean scores (dots) are shown. Error bars represent ± 1 SE.
Follow-up pairwise comparisons were performed to compare the mean gender stereotype scores between boys and girls for each age and trait. In the smart traits, there was no significant gender difference in gender stereotype scores in each age group. (4-year-olds: girl–boy = − 0.016, t(632) = − 0.239, p = 0.811; 5-year-olds: girl–boy = − 0.070, t(632) = − 1.041, p = 0.720; 6-year-olds: girl–boy = − 0.126, t(632) = − 1.956, p = 0.204; 7-year-olds: girl–boy = − 0.075, t(632) = − 1.176, p = 0.720). In the nice traits, girls scored higher than boys in each age group (4-year-olds: girl–boy = 0.196, t(632) = 2.904, p = 0.019; 5-year-olds: girl–boy = 0.320, t(632) = 4.779, p < 0.001; 6-year-olds: girl–boy = 0.238, t(632) = 3.709, p = 0.001; 7-year-olds: girl–boy = 0.359, t(632) = 5.663, p < 0.001). In summary, girls’ gender stereotype scores were generally higher than boys in the nice traits, but there were no such trends in the smart traits.
Moreover, we tested whether the children’s gender stereotype scores differed from chance level for each gender and age for each trait. For the girls’ gender stereotype scores in the smart traits, the 5-year-old children’s scores were marginally higher than the chance level, but the scores of the other children were not different from the chance level (4-year-olds: t(603) = 1.251, p = 1; 5-year-olds: t(604) = 2.550, p = 0.099; 6-year-olds: t(606) = 2.492, p = 0.104; 7-year-olds: t(607) = 1.143, p = 1). For boys’ gender stereotype scores in the smart traits, the 5-, 6-, and 7-year-old children’s scores were significantly or marginally higher than the chance level, but the 4-year-old children’s scores were not (4-year-olds: t(608) = 1.603, p = 0.656; 5-year-olds: t(599) = 3.569, p = 0.004; 6-year-olds: t(602) = 5.106, p < 0.001; 7-year-olds: t(620) = 2.670, p = 0.078). For girls’ gender stereotype scores in the nice traits, the children’s scores were significantly higher than the chance level in all age groups (4-year-olds: t(603) = 4.806, p < 0.001; 5-year-olds: t(604) = 5.642, p < 0.001; 6-year-olds: t(606) = 5.195, p < 0.001; 7-year-olds: t(607) = 6.056, p < 0.001). For the boys’ gender stereotype scores in the nice traits, the children’s scores in all age groups were not significantly different from chance (4-year-olds: t(608) = 0.991, p = 1; 5-year-olds: t(599) = − 0.982, p = 1; 6-year-olds: t(602) = 0.266, p = 1; 7-year-olds: t(620) = − 1.737, p = 0.580).
The results in Study 3 partially replicated those in Studies 1 and 2. Girls’ scores were higher than those of boys for nice traits. However, in terms of smart traits, boys’ scores were not significantly different from those of girls in each age group. These findings were inconsistent with Study 2, where boys’ scores were higher than that of girls in the 7-year-old age group but not in 4- to 6-year-old age groups. Nevertheless, the tendency was consistent in Study 2 in that older boys outperformed older girls. Given that the observed gender stereotype effects were evident in a larger sample size14, we merged the data of Study 3 with Studies 1 and 2 and analyzed the merged data when task order was included as a control variable.
Analyses of merged data
Photo stimuli task
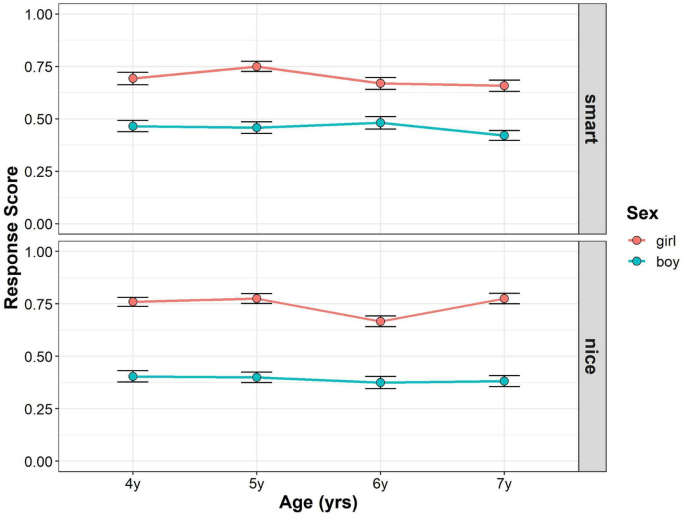
Figure 5 shows the developmental changes in the children’s response scores in the photo stimuli figure task from Studies 1 and 3 (see also Supplementary Tables S7, S8). To assess whether and how age, gender, and trait were related to the mean gender stereotype scores, we conducted multilevel mixed-effects linear modeling. For interaction terms, we found no significant effect of interaction among trait, gender, and age (F (3, 574) = 0.528, p = 0.663, power = 0.193), and between age and gender (F (3, 572) = 1.799, p = 0.146, power = 0.487), but we found significant interactions between trait and gender (F (1, 574) = 29.418, p < 0.001, power = 0.998), and trait and age (F (3, 574) = 3.234, p = 0.022, power = 0.719). For the main effects, we found significant main effect of gender (F (1, 572) = 381.156, p < 0.001, power = 1), but the main effects of age (F (3, 572) = 2.089, p = 0.101, power = 0.540) and trait (F (1, 574) = 0.394, p = 0.531, power = 0.099) were not significant. The main effect of the parents’ gender (F (1, 572) = 0.006, p = 0.936) and task order (F (1, 572) = 0.209, p = 0.648) were also not significant.

Developmental change of children’s response scores in photo stimuli task from Study1 and Study 3. Boys’ (blue) and girls’ (red) mean scores (dots) are shown. Error bars represent ± 1 SE.
Follow-up pairwise comparisons were performed to compare the mean gender stereotype scores between boys and girls for each age and trait. In the smart traits, girls scored higher than boys in each age group (4-year-olds: girl–boy = 0.227, t(1045) = 6.032, p < 0.001; 5-year-olds: girl–boy = 0.291, t(1046) = 7.724, p < 0.001; 6-year-olds: girl–boy = 0.188, t(1046) = 5.051, p < 0.001; 7-year-olds: girl–boy = 0.236, t(1041) = 6.416, p < 0.001). In the nice traits, girls scored higher than boys in each age group (4-year-olds: girl–boy = 0.355, t(1045) = 9.443, p < 0.001; 5-year-olds: girl–boy = 0.375, t(1046) = 9.939, p < 0.001; 6-year-olds: girl–boy = 0.292, t(1046) = 7.855, p < 0.001; 7-year-olds: girl–boy = 0.393, t(1041) = 10.691, p < 0.001). Although girls’ gender stereotype scores were higher than those of boys in both the smart and nice traits, the difference between boys and girls was larger in the nice than the smart traits.
Moreover, we tested whether the children’s gender stereotype scores differed from chance level for each gender and age for each trait. For girls’ gender stereotype scores in the smart traits, the children’s scores were significantly higher than the chance level in all age groups (4-year-olds: t(987) = 6.636, p < 0.001; 5-year-olds: t(1001) = 9.007, p < 0.001; 6-year-olds: t(997) = 6.042, p < 0.001; 7-year-olds: t(994) = 5.647, p < 0.001). For boys’ gender stereotype scores in the smart traits, the 7-year-old children’s scores were significantly lower than the chance level, but the 4-, 5-, and 6-year-old children’s scores were not (4-year-olds: t(1007) = − 1.293, p = 0.412; 5-year-olds: t(993) = − 1.488, p = 0.412; 6-year-olds: t(988) = − 0.715, p = 0.475; 7-year-olds: t(1030) = − 3.049, p = 0.009). For girls’ gender stereotype scores in the nice traits, the children’s scores were significantly higher than the chance level in all age groups (4-year-olds: t(987) = 8.949, p < 0.001; 5-year-olds: t(1001) = 9.906, p < 0.001; 6-year-olds: t(997) = 5.960, p < 0.001; 7-year-olds: t(994) = 9.911, p < 0.001). For boys’ gender stereotype scores in the nice traits, the children’s scores were significantly lower than the chance level in all age groups (4-year-olds: t(1007) = − 3.529, p = 0.003; 5-year-olds: t(993) = − 3.514, p = 0.003; 6-year-olds: t(988) = − 4.465, p < 0.001; 7-year-olds: t(1030) = − 4.551, p < 0.001).
Stick figure task
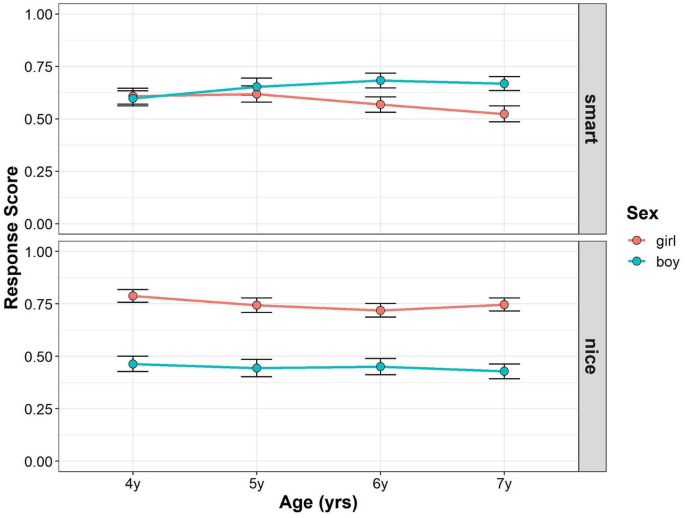
Figure 6 shows the developmental changes in the children’s response scores in the stick figure task from Studies 2 and 3 (see also Supplementary Tables S7, S9). To assess whether and how age, gender, and trait were related to mean gender stereotype scores, we conducted multilevel mixed-effects linear modeling. For the interaction terms, we found no significant effect of interaction among trait, gender, and age (F (3, 554) = 1.153, p = 0.327, power = 0.309), interaction between age and gender (F (3, 552) = 1.069, p = 0.362, power = 0.304), and trait and age (F (3, 554) = 0.995, p = 0.395, power = 0.270), but we found a significant interaction between trait and gender (F (1, 554) = 144.696, p < 0.001, power = 1). For the main effects, we found significant main effect of gender (F (1, 552) = 32.185, p < 0.001, power = 1), but the main effects of age (F (3, 552) = 0.345, p = 0.793, power = 0.114) and trait (F (1, 554) = 0.731, p = 0.393, power = 0.132) were not significant. The main effects of parents’ gender (F (1, 552) = 0.192, p = 0.661) and task order (F (1, 552) = 1.803, p = 0.180) were also not significant.

Developmental change of children’s response scores in stick figure task from Study1 and Study 3. Boys’ (blue) and girls’ (red) mean scores (dots) are shown. Error bars represent ± 1 SE.
Follow-up pairwise comparisons were performed to compare the mean gender stereotype scores between boys and girls for each age and trait. No significant gender difference in gender stereotype scores was found in the smart traits in 4-, 5-, and 6-year-olds, but the 7-year-old boys’ scores were significantly higher than the 7-year-old girls’ scores. (4-year-olds: girl–boy = 0.012, t(1040) = 0.222, p = 0.945; 5-year-olds: girl–boy = − 0.038, t(1039) = − 0.719, p = 0.945; 6-year-olds: girl–boy = − 0.114, t(1040) = − 2.271, p = 0.070; 7-year-olds: girl–boy = − 0.144, t(1037) = − 2.887, p = 0.016). In the nice traits, girls scored higher than boys in each age group (4-year-olds: girl–boy = 0.325, t(1040) = 6.262, p < 0.001; 5-year-olds: girl–boy = 0.297, t(1039) = 5.669, p < 0.001; 6-year-olds: girl–boy = 0.269, t(1040) = 5.340, p < 0.001; 7-year-olds: girl–boy = 0.319, t(1037) = 6.392, p < 0.001).
Moreover, we tested whether the children’s gender stereotype scores differed from chance level for each gender and age for each trait. For the girls’ gender stereotype scores in the smart traits, the 4- and 5-year-old children’s scores were significantly higher than the chance level, but the scores of the 6-and 7-year-old children were not (4-year-olds: t(981) = 2.813, p = 0.040; 5-year-olds: t(995) = 3.168, p = 0.014; 6-year-olds: t(992) = 1.893, p = 0.303; 7-year-olds: t(988) = 0.662, p = 0.819). For boys’ gender stereotype scores in the smart traits, the 5-, 6-, and 7-year-old children’s scores were significantly higher than the chance level, but the 4-year-old children’s scores were not (4-year-olds: t(999) = 2.621, p = 0.062; 5-year-olds: t(982) = 3.805, p = 0.001; 6-year-olds: t(983) = 4.808, p < 0.001; 7-year-olds: t(1021) = 4.657, p < 0.001). For girls’ gender stereotype scores in the nice traits, the children’s scores were significantly higher than the chance level in all age groups (4-years-olds: t(981) = 7.311, p < 0.001; 5-year-olds: t(995) = 6.479, p < 0.001; 6-year-olds: t(992) = 5.897, p < 0.001; 7-year-olds: t(988) = 6.650, p < 0.001). For the boys’ gender stereotype scores in the nice traits, the children’s scores in all age groups were not significantly different from chance (4-year-olds: t(999) = − 0.875, p = 0.819; 5-year-olds: t(982) = − 1.269, p = 0.819; 6-year-olds: t(983) = − 1.215, p = 0.819; 7-year-olds: t(1021) = − 1.958, p = 0.303).
The combined analyses showed that the girls’ scores were higher than those of boys for both the smart and nice traits in the photo stimuli task. They were more likely to attribute smartness to their own gender. Moreover, only 7-year-old boys were less likely to attribute smartness to their own gender, whereas boys in other age groups were not. Girls in each age group were more likely to attribute niceness to their own gender, and boys in each age group were less likely to attribute niceness to their own gender.
The results were consistent with those in Study 2 in the stick figure task. There was no gender difference in the 4- to 6-year-old children’s scores for the smart traits, while the 7-year-old boys’ scores for the smart traits were higher than those of the 7-year-old girls. Four and 5-year-old girls were more likely to attribute smartness to their own gender, whereas 6- and 7-year-old girls were not. Five to 7-year-old boys were more likely to attribute smartness to their own gender while 4-year-old boys were not. Girls in each age group were likely to attribute niceness to their own gender, while such attributions were at a chance level in boys in each age group.


